Learning Path
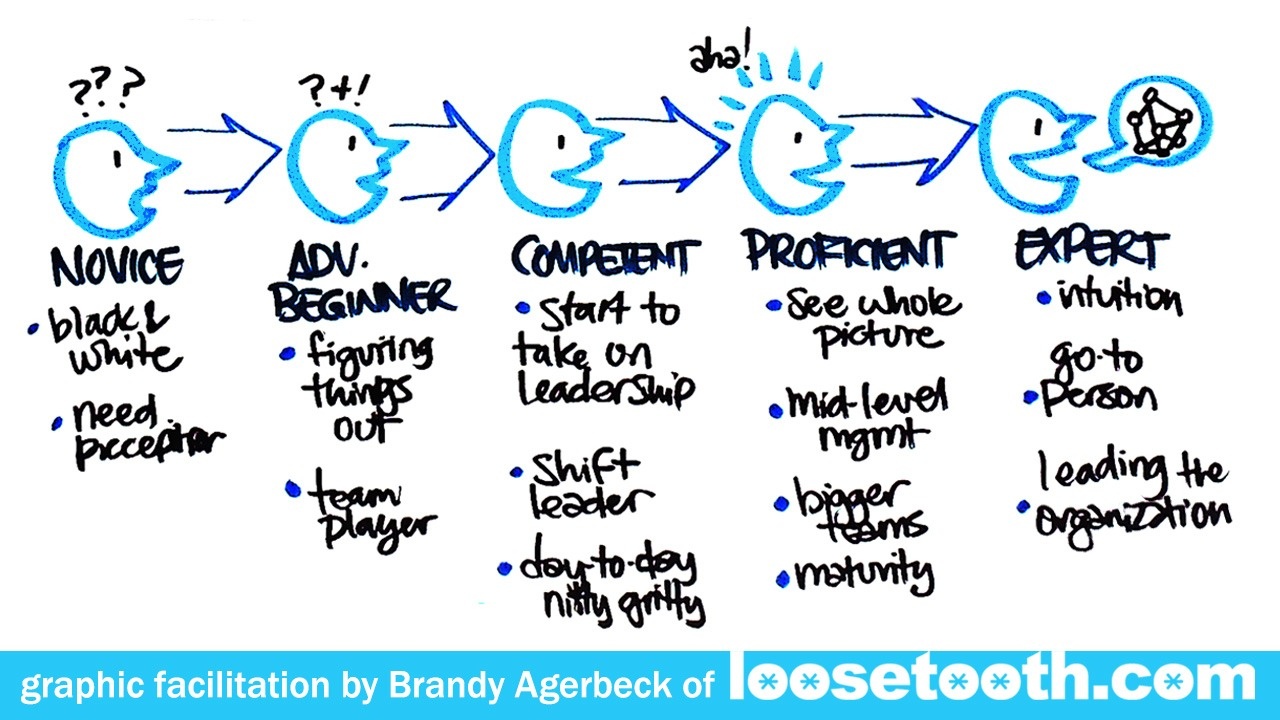
While these five steps were drawn for my graphic facilitation clients today and their industry, it's a darn universal and useful phases of learning.
Today I created three charts, each 4 feet tall by 6 feet long. One representing the work itself, the second included the piece above on career development, and the final chart on leadership.
The top third of each chart held basically a table. A row for each initiative per area. And three rough columns. Starting with Current State on the left, Changes Needed in the center, and Future Vision on the right.
This made for an efficient shape to capture lists of points across the top.
Then the lower two-thirds of each chart was open discussion.
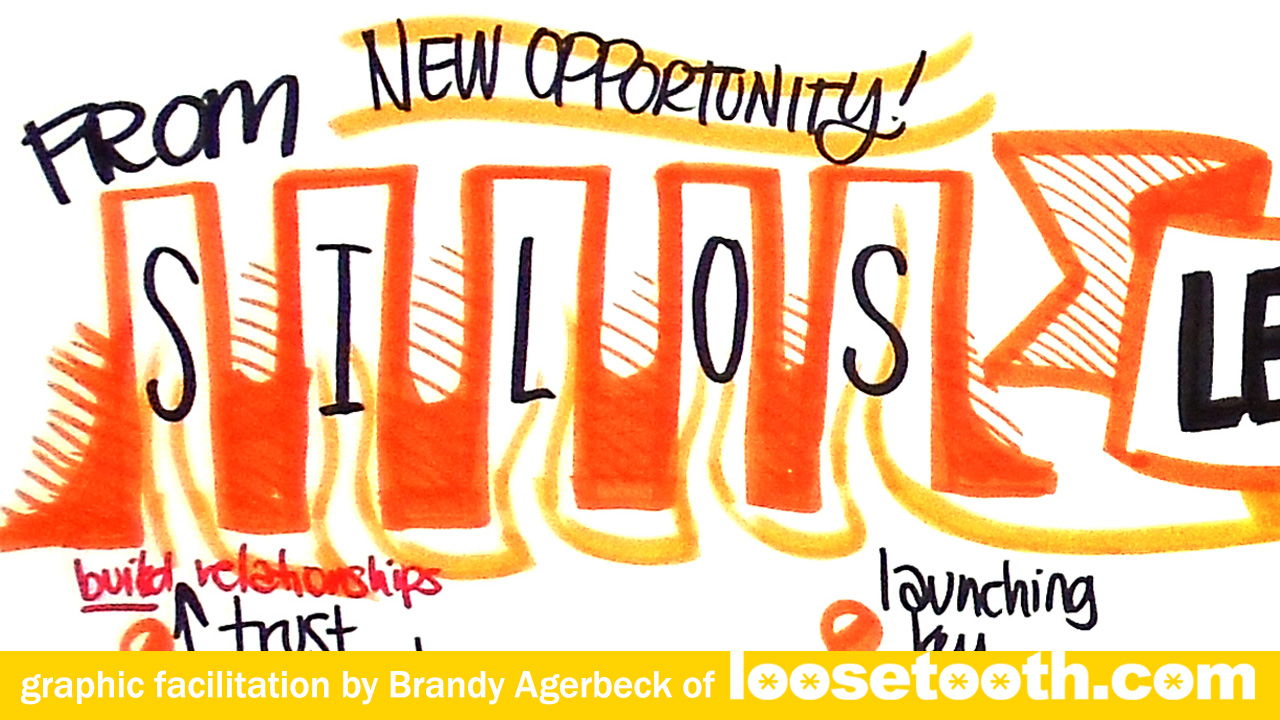
The snippet below is a very common topic, silo-busting, from the leadership chart.
Reminds me of hotrod flames. ;^D