
The 5 Steps of Visual Thinking
books facilitation + collaboration learning + teaching mapping complex systems personal work + productivity the idea shapers writing + speaking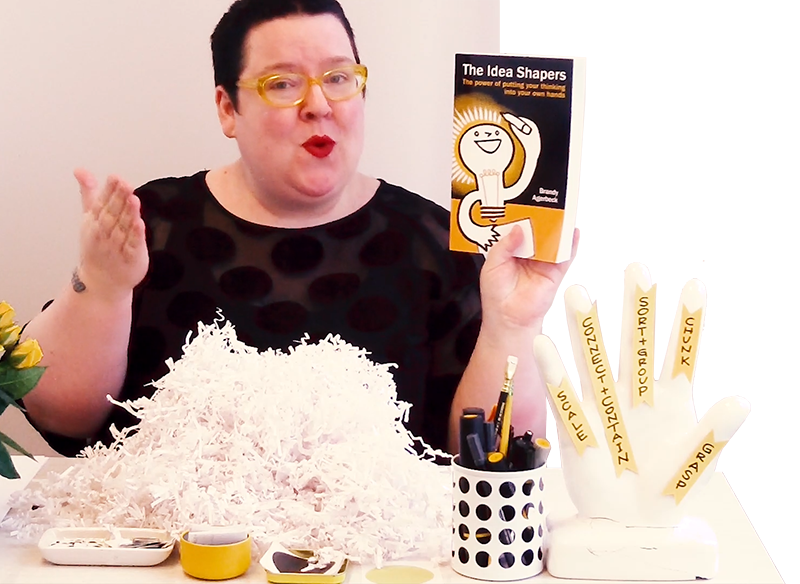
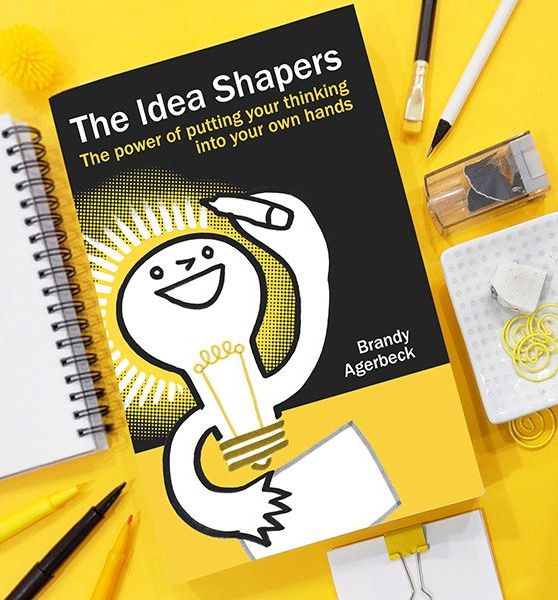
Brandy's playful walkthrough of the 5 steps of visual thinking organizing her book, The Idea Shapers: The power of putting your thinking into your own hands.
Demonstrated with dots, so you can see the mechanics without getting distracted by content.
In this video, you will learn:
-
Your first move that turns a messy pile of all sorts of points into a workable starting point
-
How two visual concepts — The Cluster and The Buffer — help you sort out your thoughts
-
How much can be conveyed with very simple lines
-
Why writing out every idea the same size on your page is misleading you — and how to fix it with scale
-
What clarity actually looks like when you put your thinking into your hands
Video Transcript | Click to expand or keep scrolling for abridged article format
Hello, I'm Brandy Agerbeck, of Loosetooth.com. And I help you reclaim drawing as your best thinking tool, so you can see and shape your life and your work in new ways.
Today, I want to share with you the five step process of the book, The Idea Shapers: The power of putting your thinking into your hands. Today I'm going to describe the five-step process using dots. So we're going to look at the thinking process, the visual thinking processes a little abstractly, using dots as our example.
So the very first step in the idea shaper process is CHUNK. Now what that means is, you begin a project, you begin some kind of complex project you're working on, whether it's writing a paper, creating a presentation, trying to prioritize everything you have to do, it may be coming to a decision, it could be problem solving. There's lots and lots of fantastic things, that visual thinking can help you do, again, using drawing as your best thinking tool.
a big pile of resources, a big pile of information. Sometimes when it's about working through your own ideas, it can just feel like all that stuff that's in your head. It's overwhelming you and making it hard to figure out where to go next.
So in that CHUNKS, step, that first step, we point to that big pile of information. And we're pulling out the most relevant chunks. So I go through my pile of information and I say, aha, this is something important to whatever my objective is, this will help me write that paper, or this is one of the points of parts of the puzzle I'm trying to solve. So you go through this big pile of information, and you pull out all those relevant chunks.
Alright, I have pulled all the relevant information for my project out of all the different resources at my disposal. Now, again, this is an abstraction, but think of this as all that information that you are using sort of the big pile of stuff. And then what you're doing in this first chunk, step in The Idea Shapers is pulling out what's relevant, what is useful to your task at hand. So the main mental process in the chunk step is discernment, figuring out what is relevant, what is useful, out of whatever your pile of sources are.
That is step one.
Within the first step of chunk, we've got four idea shapers, and each of those are about pulling out relevant information and deciding what surface you're going to put it on. Now, let's look at this pile of relevant chunks of information. All of these are going to help us write that paper, craft that presentation, make that decision, solve that problem, whatever your objective is, whatever the task is at hand. Now again, these dots are standing in four pieces of vital information.
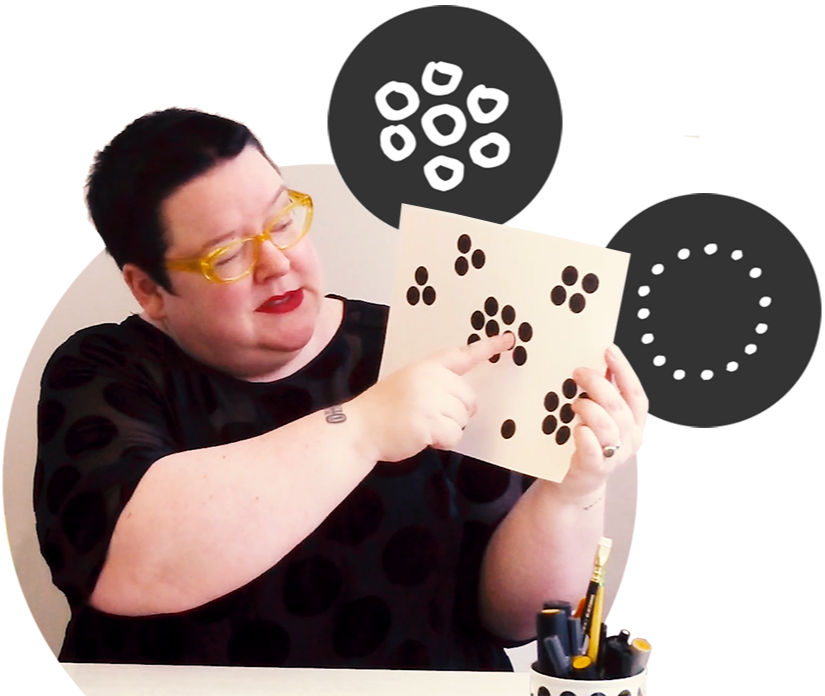
So let's talk about step number 2 to is SORT + GROUP. And very simply what we're doing with the SORT + GROUP phase, is we're looking at those chunks and saying, Okay, what patterns do I see in this information? So where am I going to put how am I going to sort this information and put it in groupings? That makes sense for what I'm trying to do?
Now a lot of the mental processing that's happening in this second step of sorting and grouping is about having different filters that help you filter out information. What needs to be in the drawing? What doesn't that was a lot of step one. With the information you have that's relevant to your project, What kind of groupings do you see form? What kind of patterns do you see emerge? Let's get these dots actually on this piece of paper. So I can demonstrate a little bit more about what happens in the second step of The Idea Shapers.
Now you can see how these different ideas have been sorted out and grouped. So similar ideas are grouped together, dissimilar ideas are pushed apart. And in this step, our idea shapers are specific visual thinking concepts like The Cluster and The Buffer. So with The Cluster, we are putting similar things together and using proximity to visually show that these nine items are all very similar to each other because they're huddled close together. So throughout this example, with our dots, you can see different groupings that because they're huddled together, the similar ideas are grouped together. And the reason The Clusters work is because you have The Buffer. And The Buffer is the white space between those Clusters that help you see one grouping from the next. So that's just a couple examples of the idea shapers specifically described in the second step of the book.
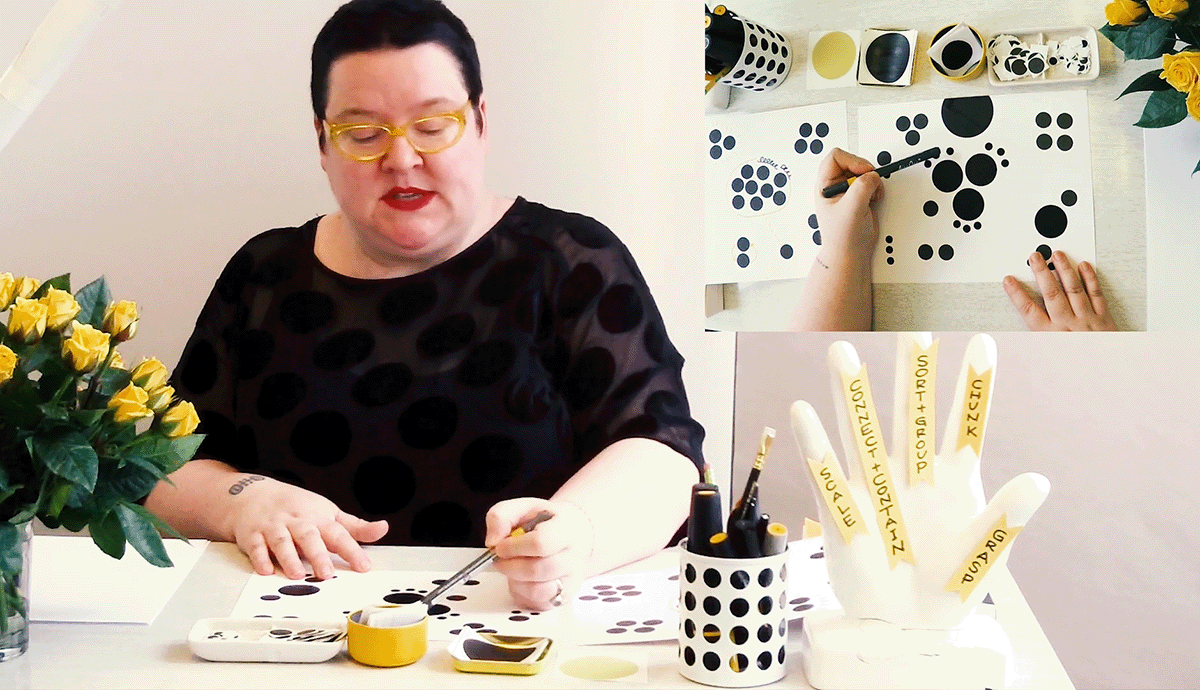
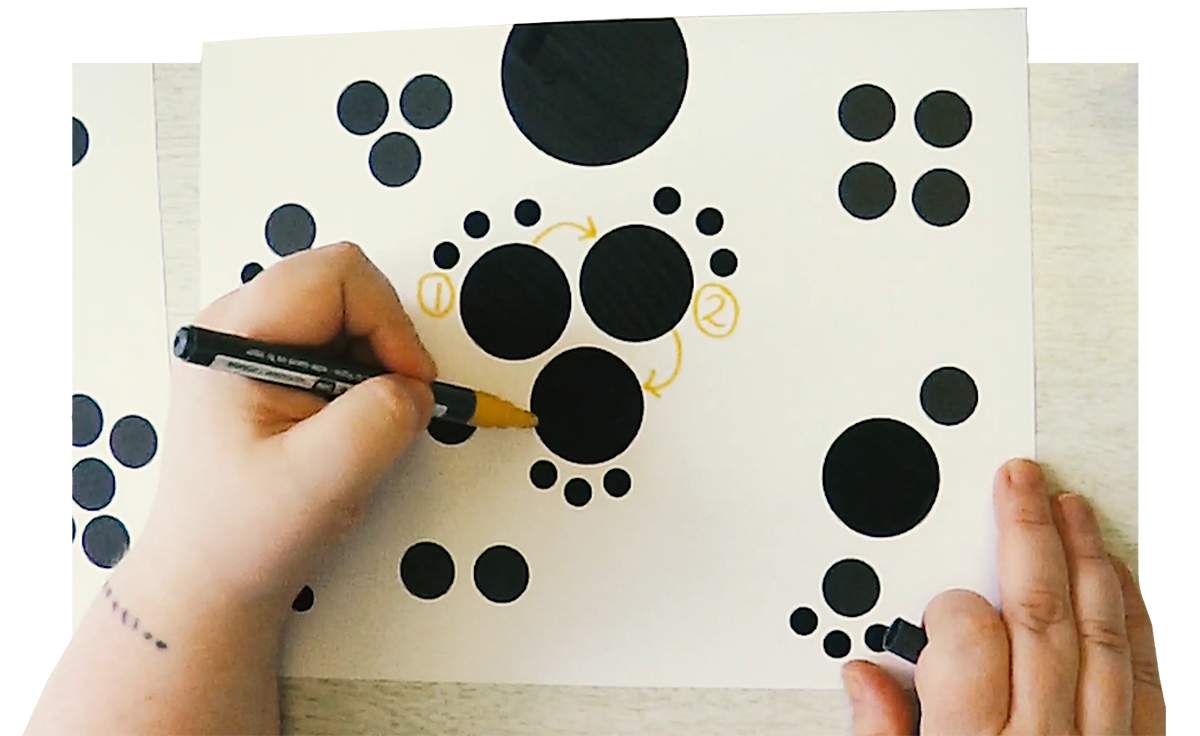
The third step in our process, and The Idea Shapers book is CONNECT + CONTAIN. And this is about showing the relationship between different ideas. So we've got our groupings sorted out on our page. And now what we're doing is we are using lines. Lines between ideas to connect them and show the relationships and lines around ideas to contain ideas and talk about what are the qualities of those items within those containers. Now I will use my yellow pen to demonstrate some of those lines between and lines around that help to further describe the ideas on the page.
For example, between these two ideas, I could create a pair of double ended arrows. This helps describe that these two particular pieces of information are relying on each other are symbiotic, as an example. Also, what I could do is take this main Cluster in the center and label it. So here I could say that this describes all nine pieces that are in this grouping. And I could create a line around it to help further illustrate that those nine things belong together, these ideas all grouped together in a pattern among my thinking.
We can also use lines to show things like tension. So perhaps these two ideas are grouped together, but there's a lot of tension between them. We could certainly use lines, maybe there's actually connection between this group of nine and this outlier over here. So one thing we could do is make a dotted line to say, "Hey, I think this might be related to that." That's something I'm going to test in my drawing. But I'm using a different type of line to demonstrate that relationship.
So very easily, you can see very quickly and easily, you can see that there is a lot you can do with very simple lines, again, between ideas, and around ideas that help show the character. Now perhaps I'm really excited about this particular grouping and a different kind of Container I can put around this is a set of the sparklines. So that shows that I am super excited about those three things. So those again are very simple examples of how lines can really help clarify the relationships between ideas and the characteristics of groupings of ideas. That is our CONENCT + CONTAIN step. Step number three.
Our next step is our little pinky finger over here, and that is using SCALE. SCALE works in two different ways. One is, what is the size of the canvas you're working on? So maybe you're working with a giant sheet of paper to expand your thinking. Maybe you're working with an 80 bitty piece of paper to help get concise and clarify your thinking like if you only have the size of a postage stamp, how would you describe this idea? If you had to fit this whole project? On a one inch, one inch button? What would you say? How would you symbolize all of that complexity? So that's the first side of SCALE.
The other side of scale is what is the size of the ideas in relationship to each other? Right now, in this drawing in this abstracted that drawing, everything is kind of the same size as everything else. And I think this is one of the most powerful parts of The Idea Shapers, of visual thinking, Is really discerning and deciding how do these pieces fit together. Because this is not our thing, how ideas actually work.
There are ideas that are bigger and overarching. There are ideas that are smaller supporting ideas. So now let's use our dots bring in these new bigger dots and smaller dots to help show how to use scale.
Let's see how this drawing changes when we introduce SCALE. Again, each one of these dots represents an idea. But unlike this example, not every idea is the same size. And a big part of visual thinking is finding the structure of what you're doing, seeing how different ideas fit together. So you may have overarching ideas with several ideas underneath them, you may find this Cluster is all about the same size. So you're always thinking about how do these pieces fit together.
Again, to help create that big picture for yourself to help make meaning for yourself to help create clarity for yourself. So let's look at what the heck, this drawing looks like. When we start to shift the scale of those ideas. Again, all that wonderful visual thinking, when we're trying to figure out how the pieces fit together.
Let's look at some of the visual choices in our dot diagram here. So we went from this sets of dots. And now you can see some changes have been made. A very large dot has been added as a placeholder for the title. This is what you would name this entire drawing. Turns out that this grouping in the center of nine dots really turned out to be three main ideas with three subsets or steps below each of those three ideas. And as I thought it through, there actually ended up being a sequence. So this acts as our first step, then we move here to number two, then we move to here, number three. And turns out that little dot that was down there is the result. So again, we're using SCALE, we're using Connectors. And in this case, we're also using sequence to create a flow between all of these ideas. Then you could actually connect these little guys to the big guys to show that they are all each one of these are sub points to each of these main points.
Up here, we could still have this as perhaps our three keys. So let's say this is three things we absolutely want to keep in mind as we're looking at this process. Turns out this little grouping over here was a one main idea. And here we had the sort of tense option over here. And here we had a really strong smooth option over there. Now these four dots are up here in the upper corner. Maybe those actually fit into some kind of visual model. So we could put these in a two by two matrix. Again, these are just examples of different types of relationships you may find between different ideas.
Now, again, down here, this lovely little pair here was very symbiotic. I shifted the orientation of those two dots here, because they're stacked on top of each other, it feels like this may be the lead, and this may be the subordinate. And now by putting them side by side, they look more equal to each other. Again, this is a lot of those visual thinking this decisions you make about proximity about placement, and how they change the meaning of the ideas.
This grouping over here, those six dots, you know, what it turned out was one main idea. And off of that main idea, were two main points. And this one had three details. This one didn't have any sub details. So here, we could say, Here's two main points off of this guy. And here are two sub points off of this one. Now, all depending on what your process is, this may be the more viable option. So imagine that you were looking at this idea. And you were thinking, well, I want to go with the one that has the most possibilities. So then you choose this one. Now, flip that what if those little dots were obstacles. If that were the case, then you'd want to go with this choice, because there you don't see any obstacles in your way.
So you can see how putting all these different ideas in relationship to each other can really help you think through a project to help problem solve to help make decisions and help prioritize.
And lastly, just these little three guys in the corner, when it turns out, instead of being equal to every other idea on the page, just kind of three little points over here, little details, and maybe we put bullet points beside them, and group them in a Container.
So again, I know this is an abstracted app, abstracted example. But hopefully it helps demonstrate some of the very, very, very simple visual thinking skills, that components that go into visual thinking more broadly. And that is exactly what The Idea Shaper book is teaching you how to think about SCALE, how to think about those Connectors, how to think about how all those different ideas relate to each other.
Now, this is what happens after those first four steps, you step back, and you GRASP your information in new ways. This is the most exciting part to me, this is the synthesis. This is the new meaning made. This is when you look at what you've done, and you go, "Ah, I have a new level of understanding with this project." With this decision I'm trying to make with this speech. I'm trying to craft the presentation. I'm trying to craft or the paper I'm trying to write. That's when we create that new meaning for ourselves. That's when we create clarity.
So all of these steps I have described to you in this process with these dots are in The Idea Shapers: The power of putting your thinking into your own hands. So hop on over to Amazon.com. Order your own copy and learn much much more about how you can use drawing as your best thinking tool. I'm Brandy Agerbeck of Loosetooth.com and thank you so much for watching.
Drawing is your best thinking tool.
Not the kind of capital-A Art type drawing.
Visual thinking is the messy sketches that get you out of your head and working with your ideas.
One of the benefits of visual thinking is that it is non-linear. Still, I'll break down this complex skill set into 5 broad steps to help you see and understand how it ticks.
Step 1 | CHUNK
Every project starts as a pile. A pile of resources, a pile of notes, a pile of stuff in your head. Whether you're writing a paper, building a presentation, making a decision, or solving a problem — the starting condition is the same. The pile is overwhelming you and making it hard to figure out where to go next.

CHUNK is the first move.
You point at the pile and pull out the relevant pieces.

The mental work here is discernment.
What's useful to the task at hand? What's not? You're not organizing yet — you're choosing.
The other decision in CHUNK is your surface you are putting your points on. A notebook, a wall, a whiteboard, a sticky note. The surface you choose shapes what comes next.
Step 2 | SORT + GROUP
Now you've got your relevant chunks.
The question shifts: what patterns are here?
SORT + GROUP is where you arrange.
Similar ideas move close together. Dissimilar ideas push apart. The two visual techniques, two of 24 in the book, doing the work are The Cluster and The Buffer.
The Cluster uses proximity. When dots huddle together, you read them as related — instantly, no labels needed. Nine dots in a tight group are one idea family.
The Buffer is the white space between clusters. It's what makes the groupings legible.
This step is filtering at a finer grain. CHUNK decided in or out. SORT + GROUP decides this belongs with that.
Step 3 | CONNECT + CONTAIN
Once your groupings sit on the page, you can show how they relate. CONNECT + CONTAIN has two core uses for lines:

Connectors
Lines between ideas that show relationships between specific points

Containers
Lines around ideas that set them apart. The shape of the container creates distinctions.
Does what it says on the tin, right?
A pair of double-ended arrows says two ideas are symbiotic — they rely on each other. A dotted line says, "I think these might be related — I'm testing it." Different line types, different relationships.
Draw a line around a grouping and you're saying these nine things go together as a unit. Label it and you've named the grouping. Use sparklines around a group and you've flagged it — this is the part you're excited about.
Simple lines, doing a lot of work.
And lines anyone can draw.
Step 4 | SCALE
SCALE works two ways.
The first is the canvas.
A giant sheet of paper expands your thinking.
A postage stamp forces compression.
If you had to fit your whole project on a one-inch button — what would you say? How would you symbolize all that complexity?
The second is the relationship between ideas on the page.
In a flat layout, every dot is the same size — which is not how ideas actually work. Not every idea is the same size or importance. Some ideas are bigger and overarching. Other ideas are supporting ideas, down to the tiniest details.
Once you start sizing the dots, you can see how the pieces fit together.
A very large dot represents the title. Three medium dots become main points, with three smaller dots stepping below each as sub-points or sequence.
A pair of stacked dots reads as lead-and-subordinate; the same two dots side by side read as equals.
Proximity, placement, and size all carry meaning. Use them on purpose.
Step 5 | GRASP
After those first four steps, you step back.
You GRASP your information in new ways.
This is the most exciting part to me. This is the synthesis. This is the new meaning made.
You look at what you've done and go, "Ah, I have a new level of understanding with this project."
With the decision you're trying to make. With the presentation you're trying to craft. With the paper you're trying to write.
That's when we create that new meaning for ourselves.
This is how we create clarity.
These five steps are the spine of The Idea Shapers: The power of putting your thinking into your own hands.
-
CHUNK
-
SORT + GROUP
-
CONNECT + CONTAIN
-
SCALE
-
GRASP
Each step's section contains the specific idea shaper techniques (Cluster, Buffer, etc) within that step.
All 24 idea shapers give you everything you need to make visual thinking your lifelong skill.
Suggested Posts + Pages
Click on a card to explore more:
Brandy Agerbeck
In school, Brandy morphed her school assignments into craft projects. Thankfully, she had teachers who gave her the space to learn with her hands. This fast-brained kiddo, nonstop drawer grew into an adult who now makes abstract concepts tangible.
The five steps in this video were first introduced in Brandy's 2013 TEDx Talk, Shape Your Thinking.

Visual Thinking for:
Personal Work + Productivity
Writing + Speaking
Mapping Complex Systems
Learning + Teaching
Facilitation + Collaboration
Brandy's work
books | graphic facilitation | personal | sketchnotes | speaking
