
Visual Tools Index

by Brandy Agerbeck
Visual Thinking is an umbrella that holds a wide variety of ways we make sense of the world around us through visual tools.

Many of these tools are flexible enough that they don't easily fit into tidy categories, but you'll see some qualities to the right of the descriptions.
Curious about drawing to THINK/SEE/SHOW/DO? Join me at my next Drawing as a Verb session.
👇

Bullet Journal
Organize your time, tasks, and thoughts in a systematic way using a grid or dot grid journal. Developed by Ryder Carroll.
Commonplace books, Building a Second Brain
🟡 drawing to THINK
🐢 ongoing process
🐝 productivity tool

Caricature
Cartoon portrait that both captures a person's likeness and exaggerates specific characteristics.
🔵 drawing to SEE

Cartooning
Line drawings that simplify and stylize the subject. Often humorous.
🔵 drawing to SEE

Charrette
A collaborative planning and design process often used in architecture, urban design, and community planning to involve residents, business owners, and other stakeholders in the design process.
Read more: "What is a Charrette?"
🟢 drawing to DO
👨👩👧 group process
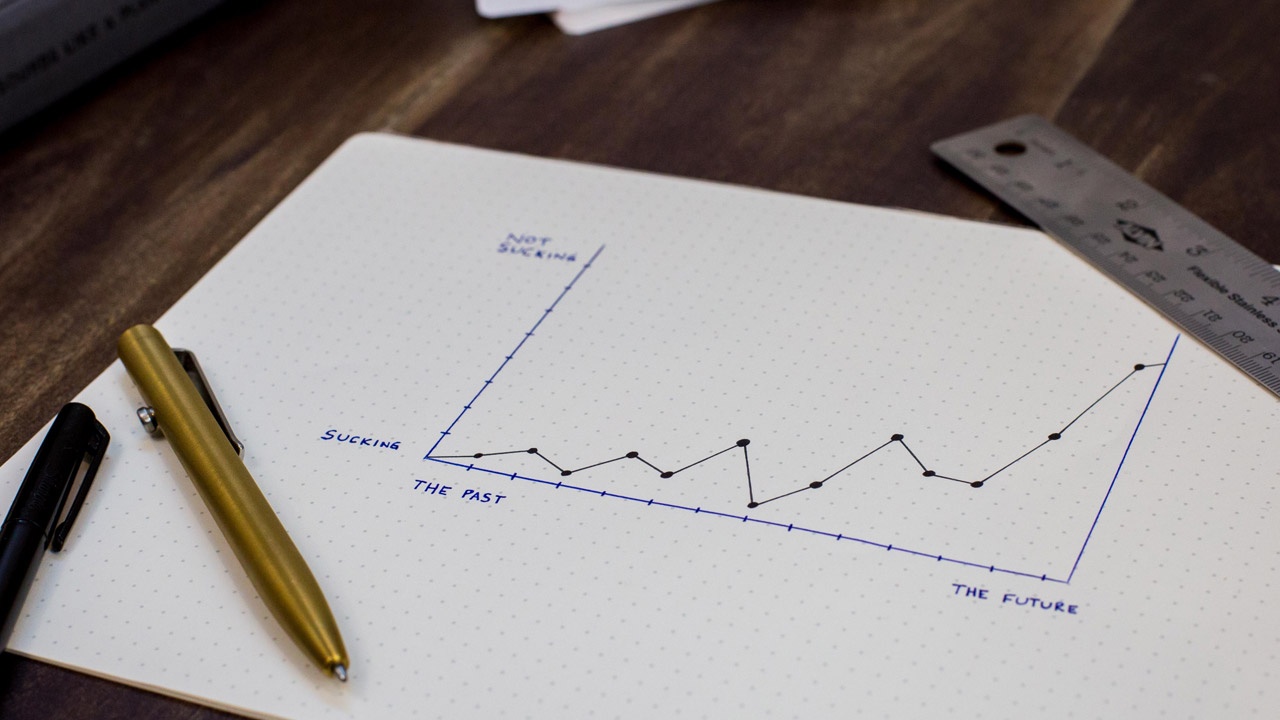
Charts
Visual representation of how sets of data relate to each other.
Graphs
A type of chart plotting one set of data on the X-axis, another set on the Y-axis.
🔴 drawing to SHOW

Classical Drawing
Traditional techniques of representational/realistic drawing emphasizing composition, proportion, anatomy, and the use of light and shadow.
🔵 drawing to SEE

Comics
Stories told panel-by-panel through images and text. As short as a comic strip, or as long as a series of graphic novels.
Comic strips, graphic novels, graphic storytelling, sequential art
🔴 drawing to SHOW
➡️ sequential
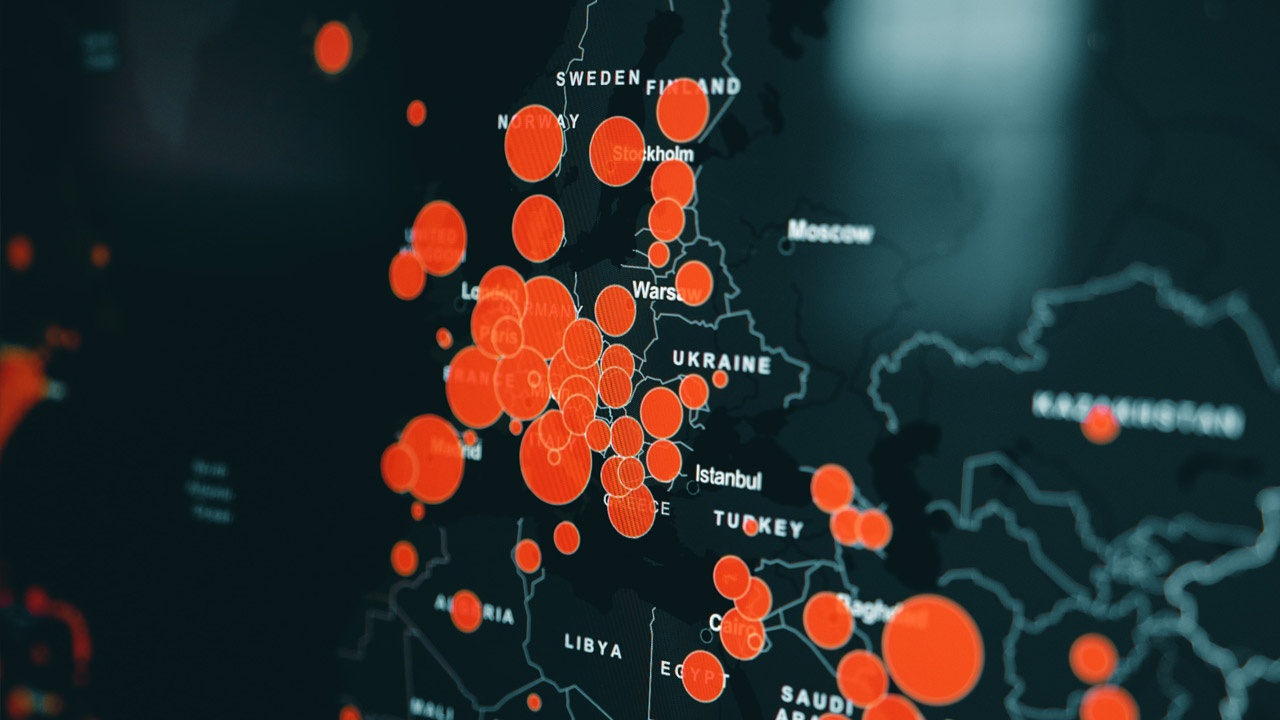
Data Visualization
Graphical representations of data in the form of charts, graphs, and maps. At its best, data visualization makes patterns, trends, and relationships in data easier to understand, leading to new insights and aiding in decision-making.
🔴 drawing to SHOW

Flash Cards
A memorization and learning tool of small, individual cards, often with a question on one side and the answer on the reverse.
🟡 drawing to THINK
🍎 learning tool
🐁 small scale

Flip Charts
A large pad of paper mounted on a easel used to display or capture information. A speaker can draw out their concept live. Simon Sinek's Start with Why being the flipchart seen millions of times.
Alternatively and more commonly, facilitators and participants use flip charts to capture their work live.
Flipcharts, easel pads
🟢 drawing to DO
👨👩👧 group process
🐘 large scale
🐇 real-time
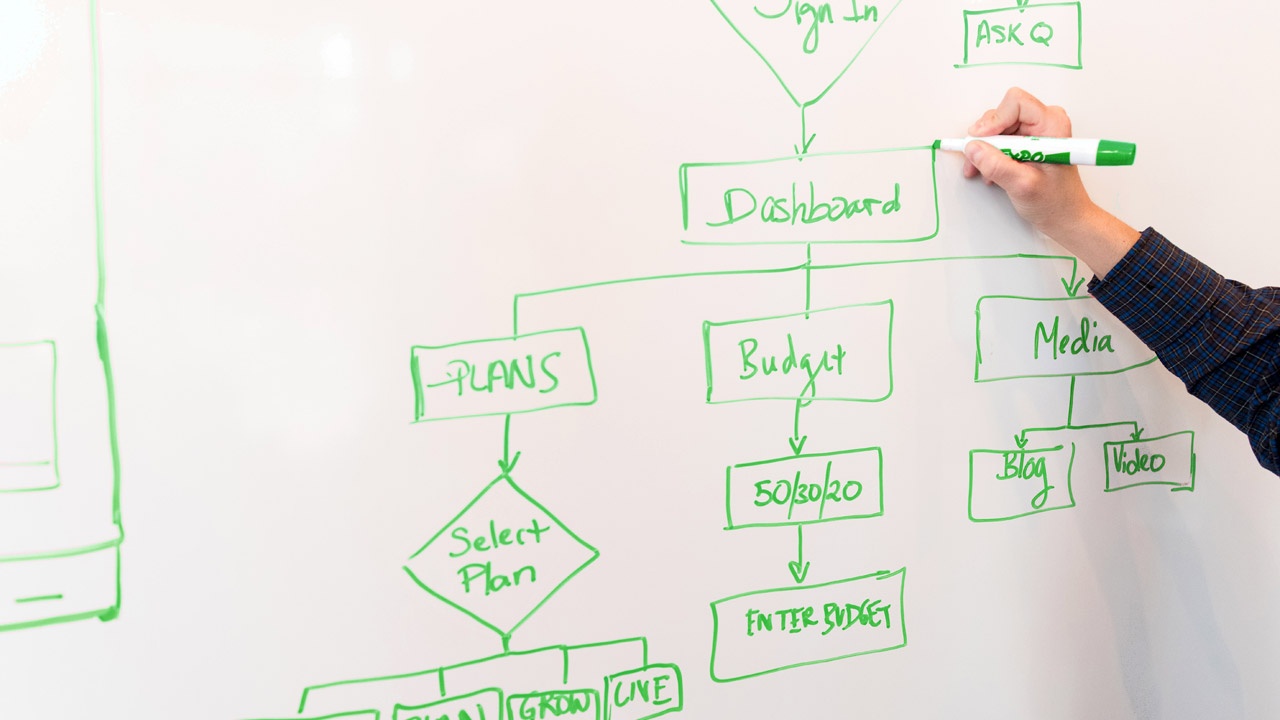
Flowcharts
A diagram of a process or system that uses shapes, symbols, and arrows to illustrate the flow of steps or decisions.
Flowcharts make complex processes visual leading to:
- Delineating sequence
- Mapping decision points
- Spotting bottlenecks
- Identifying gaps and complications
- Improving efficiency
Common use cases: project management, business process, and software development.
Gantt charts, swim lanes, process diagrams, process map, flow diagrams
🟢 drawing to DO
👨👩👧 group process
➡️ sequential
Diagram
dfgdfgdfg
🔴 drawing to SHOW
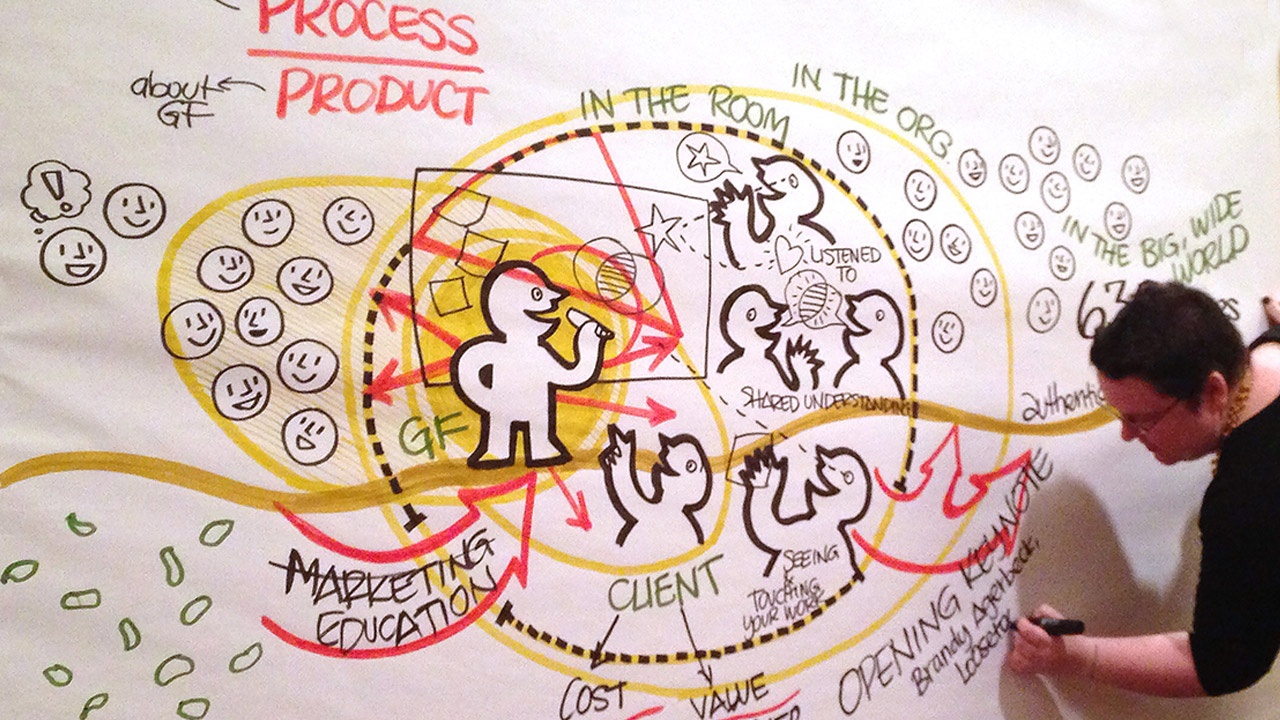
Graphic Facilitation
Large-scale, live capture of a group's conversation or a speaker's presentation.
Graphic recording, scribing, visual facilitation, visual recording
🟢 drawing to DO
👨👩👧 group process
🐘 large scale
🐇 real-time
Graphic Organizers
DFDFGDFG
🟡 drawing to THINK
🍎 learning tool
🐁 small scale
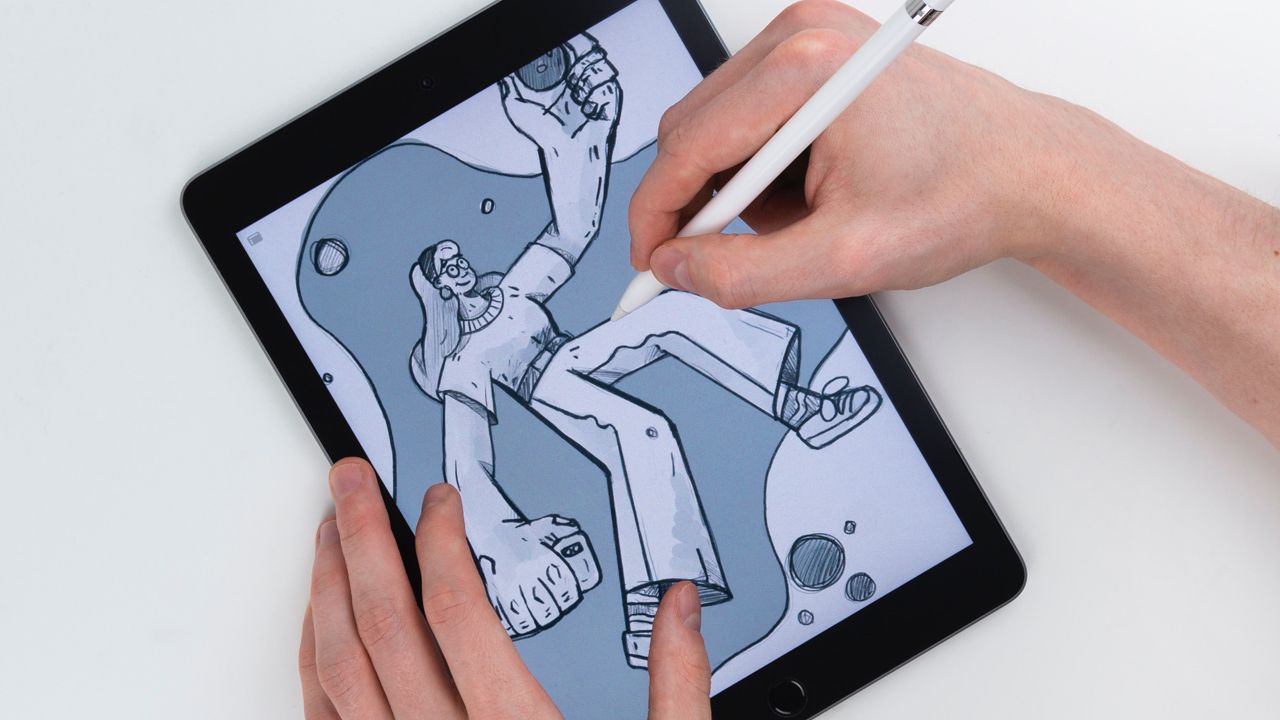
Illustration
Imagery created to help tell a story, add dimension to a concept, enhance text, convey an idea.
It can range from general imagery that makes a page more appealing or reinforces a brand, to specific scenes of an action to tell a story.
Editorial Illustration, Character Design, Medical or Scientific Illustration
🔵 drawing to SEE
🔴 drawing to SHOW
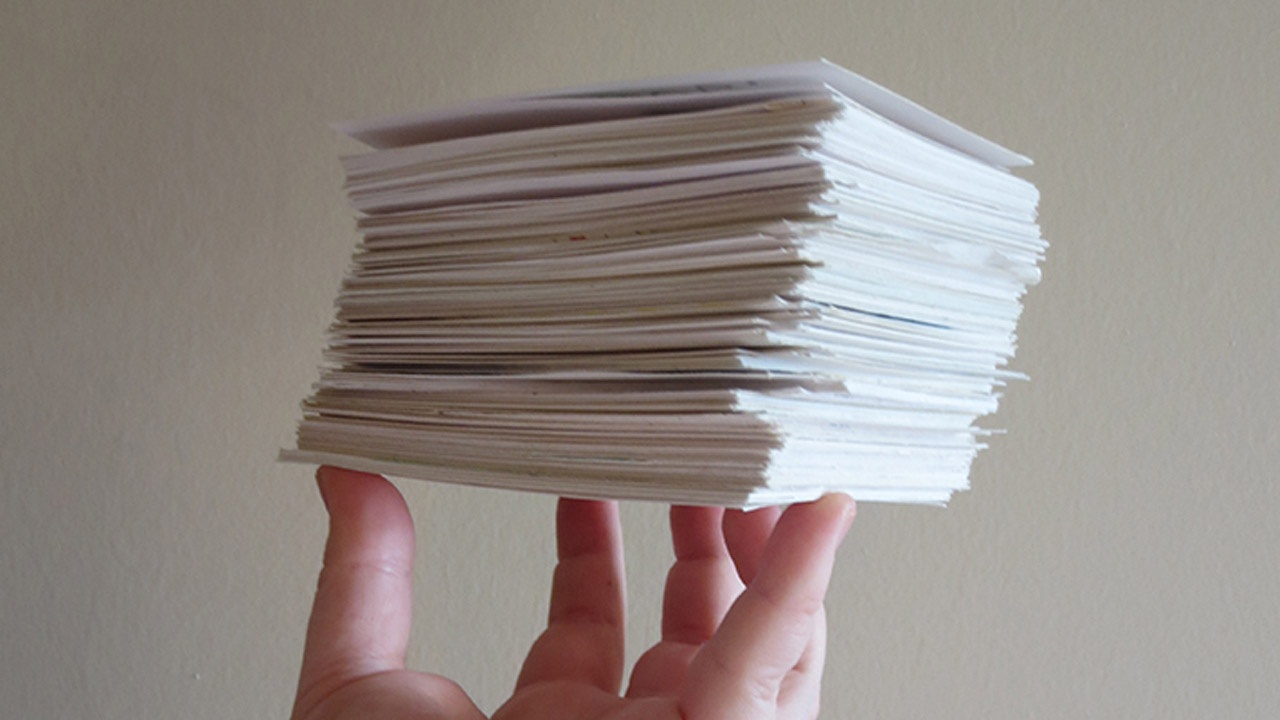
Index Cards
Making your thinking modular with 1 idea per card, slip, or sticky note.
The Stack, Pile of Index Cards (PoIC), or zettlekasten
🟡 drawing to THINK
🍎 learning tool
📖 writing tool
🐁 small scale
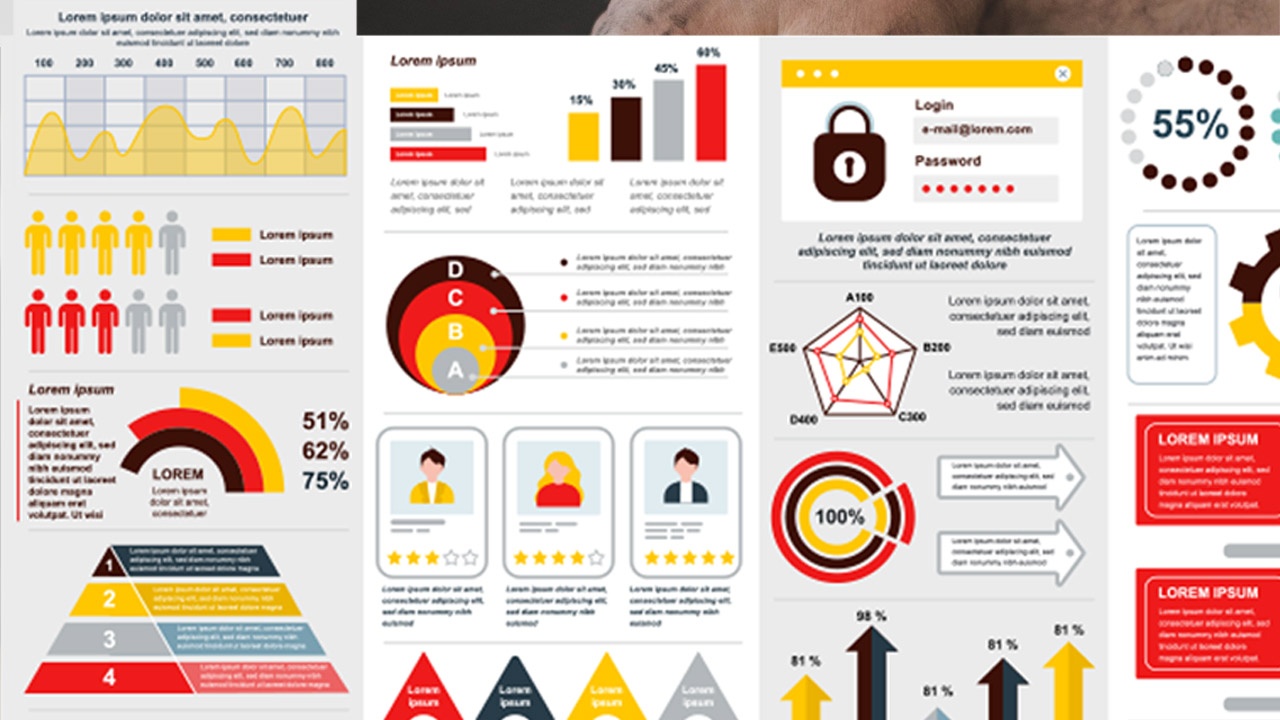
Information Graphics
Visually clear and compelling compilation of data, tips, information. An infographic can contain combinations of:
- charts
- graphs
- images
- timelines
Widely used in advertising, journalism, education, and social media.
Infographics
🔴 drawing to SHOW
Maps
drgdfgdfg
Empathy Maps, Journey Maps
🔴 drawing to SHOW
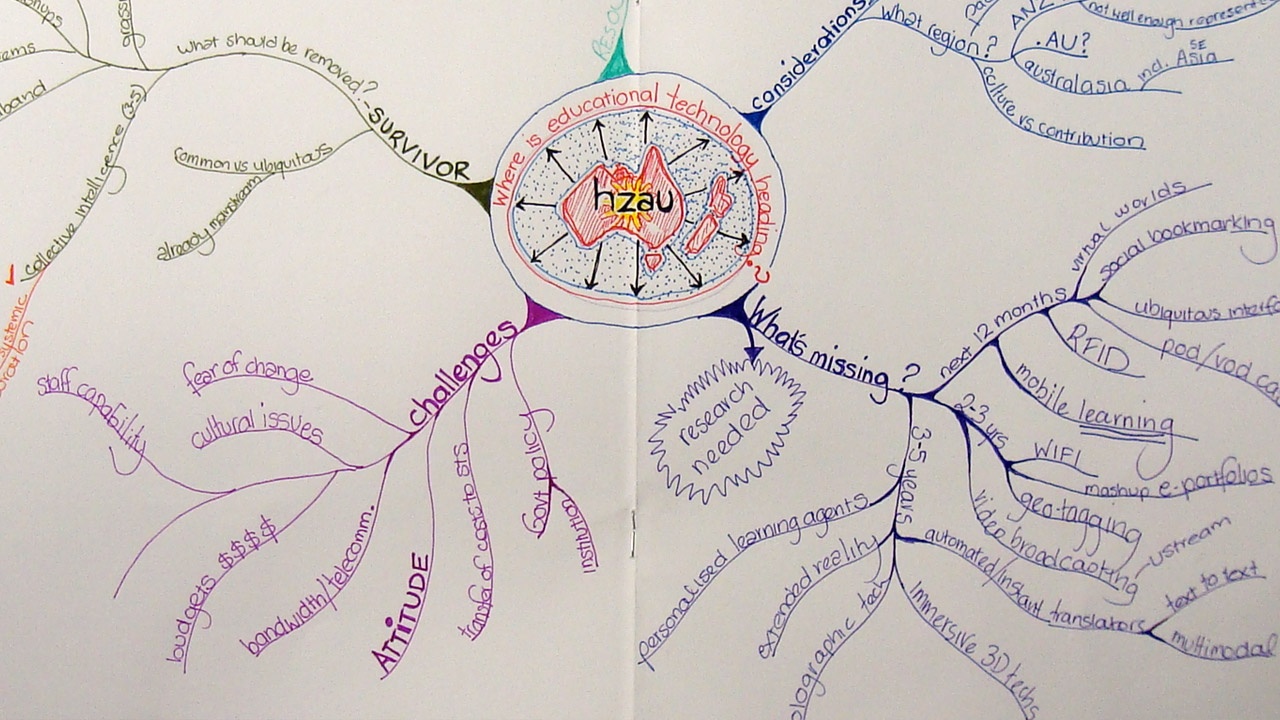
Mind Maps
Developed by Tony Buzan, mind maps are hub-and-spoke diagrams expanding on a concept or theme.
Starting with a central question or idea. Lines radiate from the center like neurons or branches, capturing words, phrases and images related to central concept.
Concept Mapping, Idea Mapping, Mind Model, Visual Mapping
🟡 drawing to THINK
🍎 learning tool
📖 writing tool
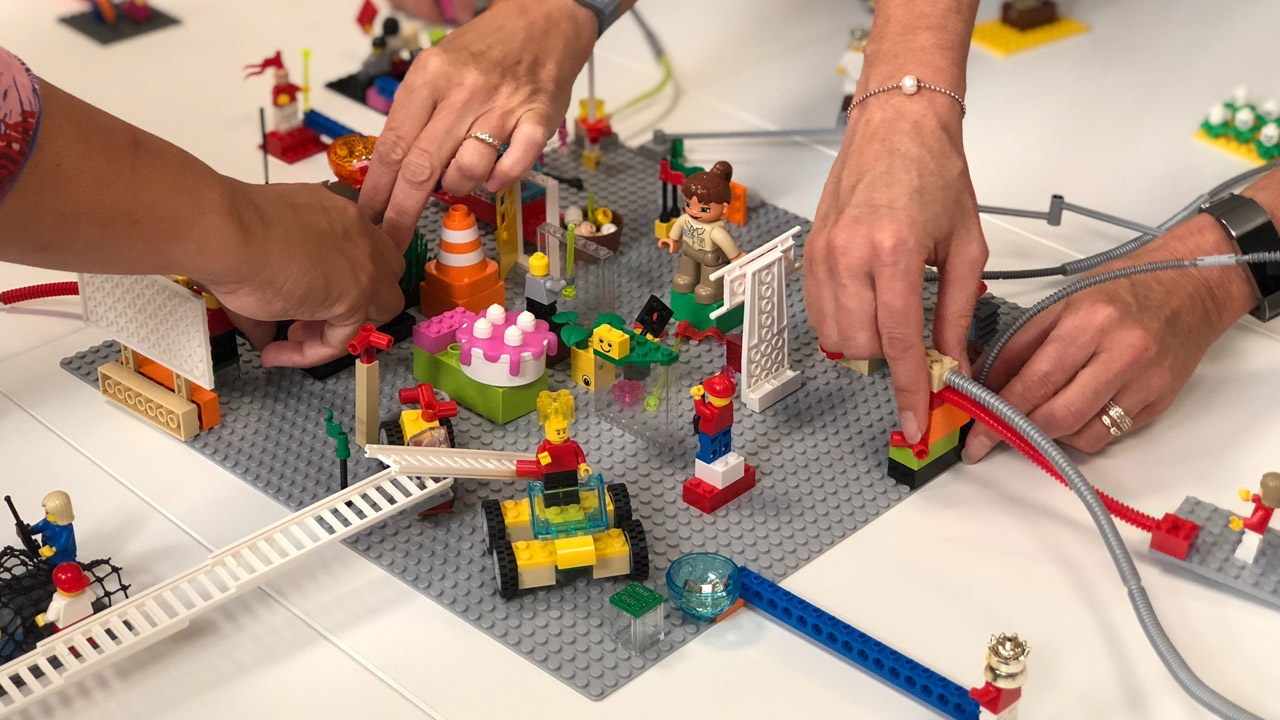
Modeling
Use of physical materials to map out relationships within a complex system.
Kinesthetic modeling, LEGO® Serious Play
🟢 drawing to DO
👨👩👧 group process
🖐️ kinesthetic

Presentation Design
Visual support of presentation or lesson through a sequence of single slides.
At its worst, it is "Death by Powerpoint." Poor design can be created by any tool, but the least effective use of this tool is putting people in a dark room and reading from your slides.
At its best, projected images and text support what the speaker is saying, keeping the audience engaged, and helping make the messages memorable.
🔴 drawing to SHOW
➡️ sequential
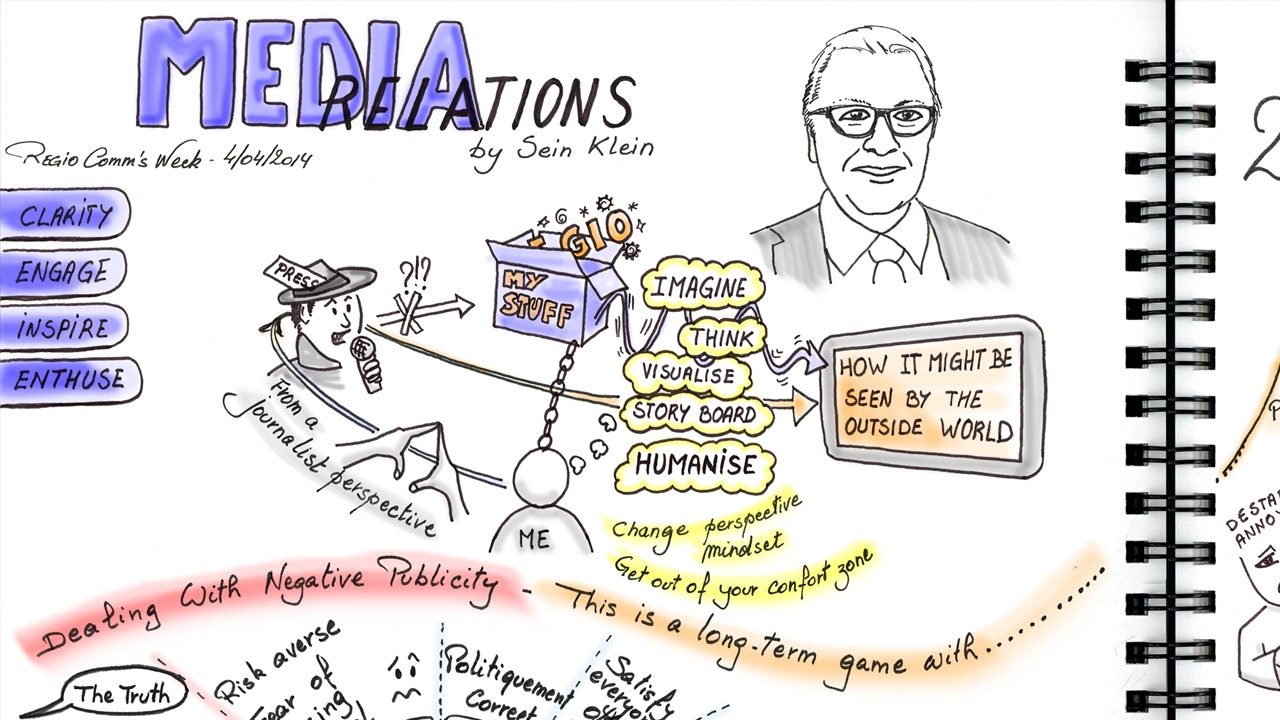
Sketchnotes
Visual notes drawn in real-time. Coined by Mike Rohde in 2007, his original format was pocket-sized moleskin notebooks that forced him to distill, organize and illustrate what he was hearing and seeing.
Sketchnotes have also expanded to landscape formats of A4 to A5 scale (letter, and half-letter) paper.
Visual notetaking, Real-time visual journaling
🟡 drawing to THINK
🍎 learning tool
🐇 real-time
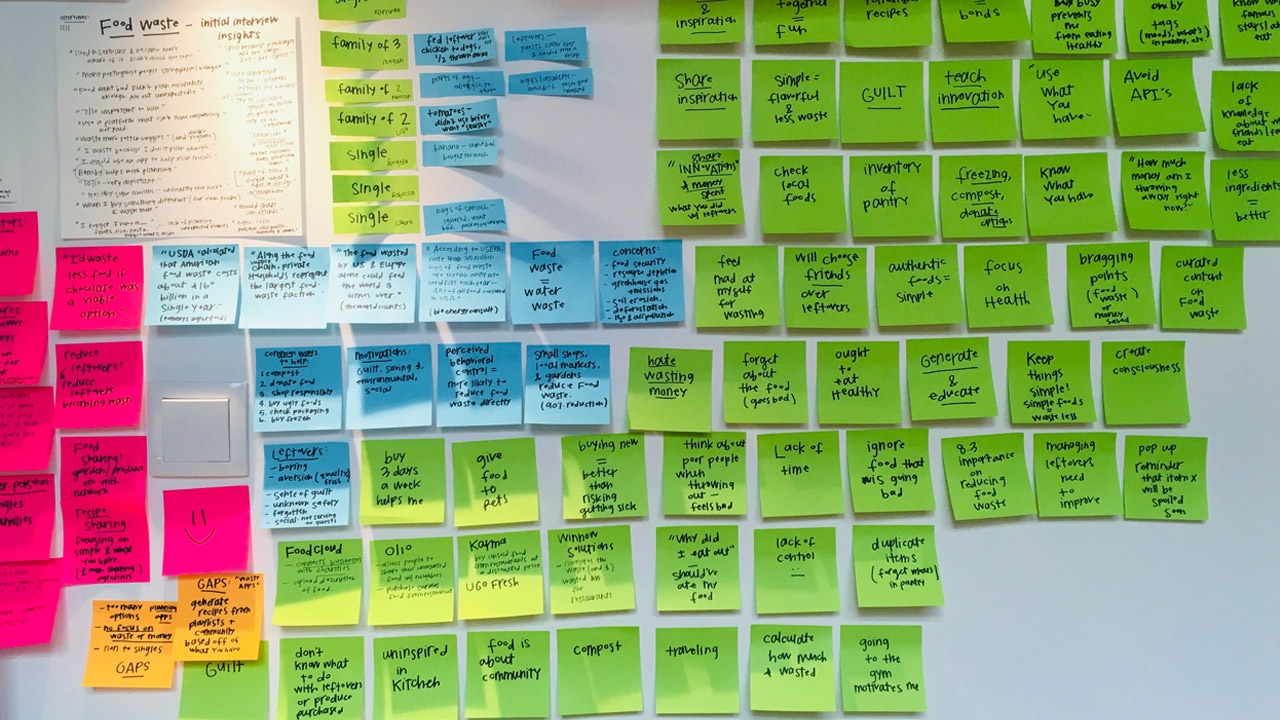
Sticky Note Clusters
Spatial organization of sticky notes on a wall, desk, or other flat surface.
This flexible format allows for:
- Timelines and sequences
- Groupings of similar points
- Columns by category
- Selection and prioritizing
- Color-coding by area, team, topic
🟢 drawing to DO
🟡 drawing to THINK
👨👩👧 group process
🟨 modular

Storyboards
Storyboards are a sequence of drawings that can better plan out a narrative (film, video, animation) or process (user experience). Storyboarding helps clarify decisions and problems in the planning phase and creates a common vision when shared with others.
Thumbnails, visual scripts, animatics
🔴 drawing to SHOW
🟢 drawing to DO
➡️ sequential

Technical Drawings
Precise and detailed illustrations used to communicate design and technical information in various fields, including engineering, architecture, manufacturing, and construction.
Technical drawings can be created throughout a design process: concept phase, planning, manufacturing, dosumentation.
Drafting, Mechanical Drawing, Architectural Drawing, Electrical Drawing, Engineering Drawing
🔴 drawing to SHO
🟢 drawing to DO
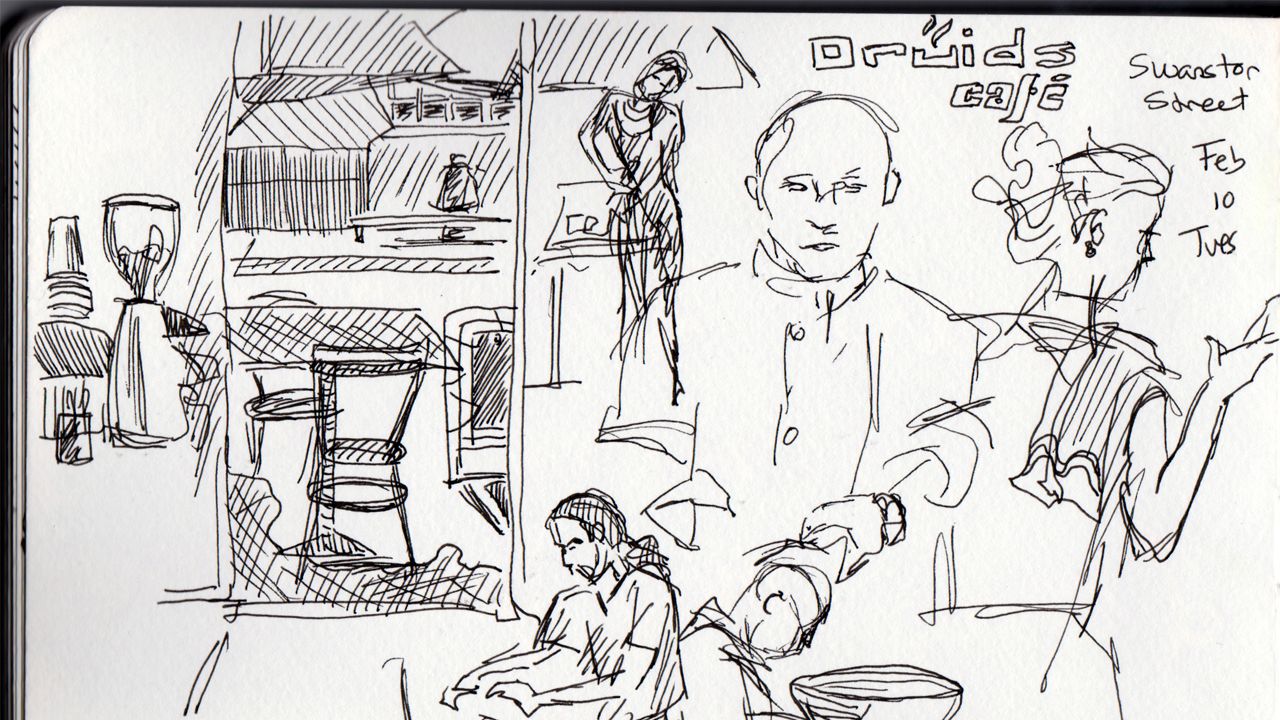
Urban Sketching
Observational, on-site, live drawing that focuses on capturing the spirit of a place and people, through the sketcher's perspective.
Plein Air sketching is the broader term for sketching outdoors, often in nature.
Street Sketching, Urban Drawing
🔵 drawing to SEE
🐇 real-time

Visual Journals
Hybrid of a diary and a sketchbook, visual journalling is a broad term for capturing your experience in words and images.
It can range from annotating one's diary with observational drawings to expressionistic mixed media books with few words, if any.
Art Journaling, Creative Journaling, Mixed Media Journaling, Visual Diary
🟡 drawing to THINK
🐢 ongoing process

Whiteboarding
Collaborative group process using a whiteboard, or similar surface to work through concepts, problems, or planning.
With multiple people at the board, a team can get their ideas out quickly. The temporary medium allows for quick revisions.
🟢 drawing to DO
👨👩👧 group process
🐘 large scale
🐇 real-time
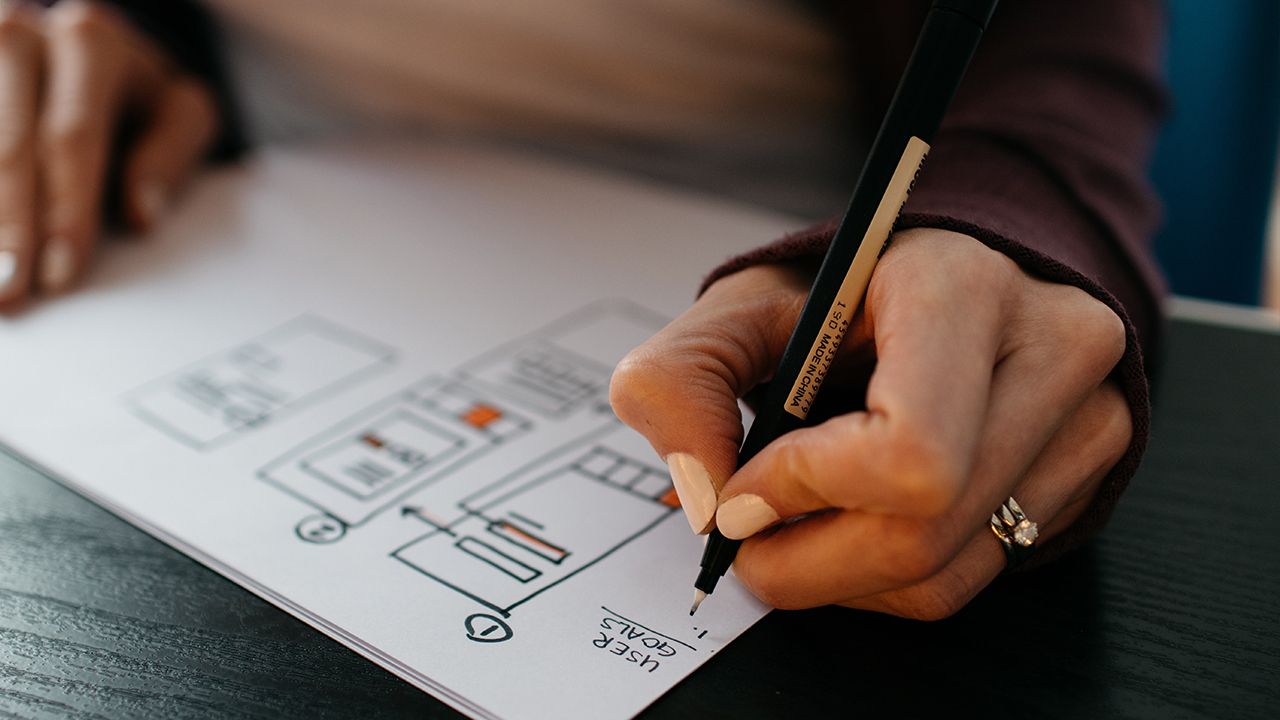
Wireframes
What blueprints are to architecture, wireframes are to digital products (sites, apps, software, etc).
These drawings are skeletal frameworks of navigation, layout, interactive components are a communication tool for feedback, validation, and development.
🔴 drawing to SHOW
🟢 drawing to DO
Share "Visual Tools Index:"
Interested in more articles like this?
Complete your information below and click Submit to subscribe to Brandy Agerbeck's updates
Once you confirm via email, you will be subscribed. Your information is secure and never shared. Unsubscribe any time.
